Why Your Business Needs To Get Visual
There’s no doubt that visual content drives up engagement numbers and are key to capture mindshare. With stats like these, businesses can see why visuals are so important to their brand. Our marketing professionals at CMDS, a top Marketing Agency in NJ, have put together the ultimate Infographic on Infographics to show you why. Take a look at the The Ultimate Infographic on Infographics by the professionals at CMDS.
(Click infographic to enlarge)
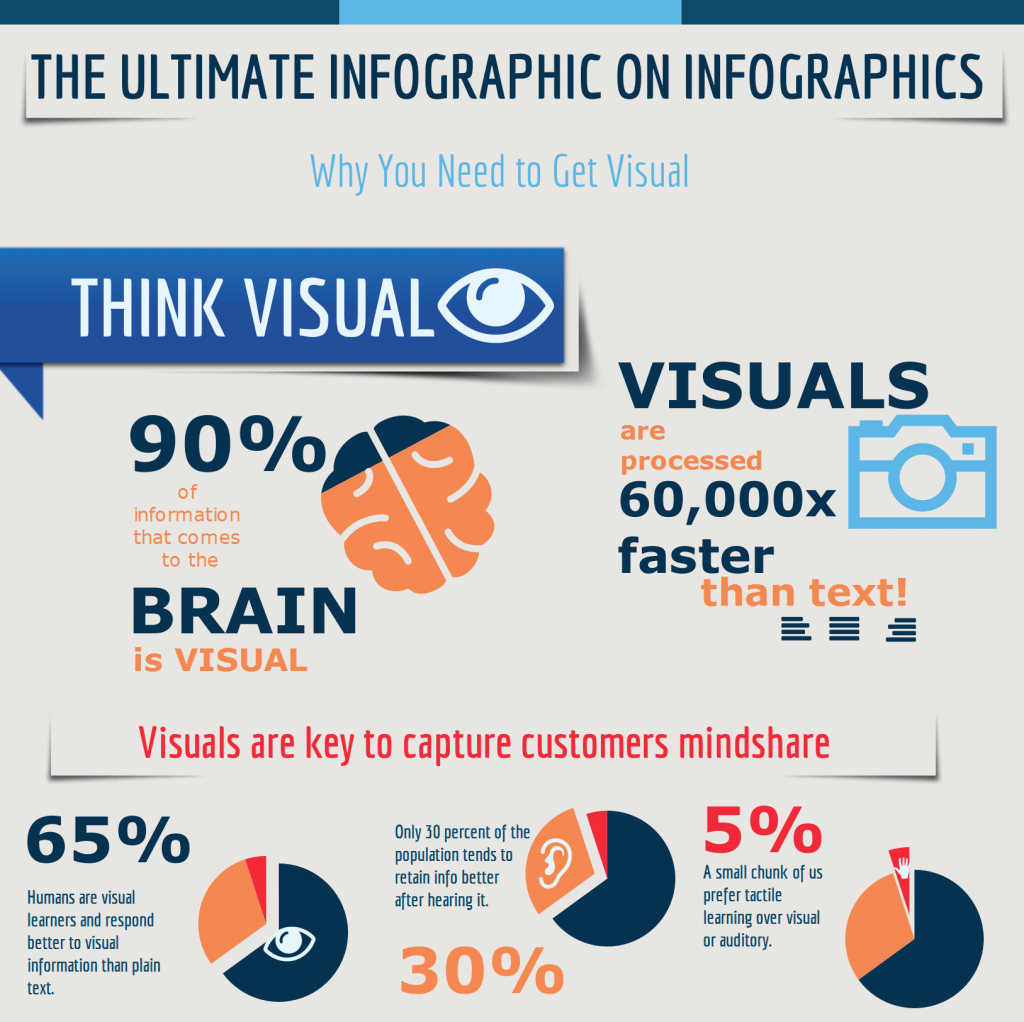
• 90% of the information that comes to the brain is visual.
• Visuals are processed 60,000x faster than text.
• Businesses who use infographics grow in online traffic an average of 12% more than those who don’t.
• Learning styles are a part of people’s personal characteristics.
• 65% of humans are visual learners and respond better to visual information than plain ol’ text.
• Only 30% of the population tends to retain information after hearing it.
• And just 5% of us prefer tactile learning over visual or auditory learning.
• The term “infographic” results in approximately 77 million results on Google and this number keeps growing.
• 200% more images are liked on social media over text resulting in more likes, comments and shares.
• Brands use infographics for press releases, marketing, social media engagement, blogs, surveys and advertising.
Online Marketing with CMDS
We help businesses and brands inspire, educate and engage current and prospective customers through strategic online marketing and shareable visuals. Create an infographic for your brand today with CMDS.
